
The biggest gains in enterprise forecasting usually come from the simplest model that reliably beats today’s process, not the most advanced one. This guide compares statistical methods, traditional ML, LLMs, and LQMs, then shows when an LQM pilot is justified and how to evaluate it.
Enterprise forecasting has never had more model options, and that is precisely the problem. Large language models dominate boardroom conversations, large quantitative models (LQMs) are drawing serious investment, and meanwhile the statistical and machine learning methods that run most demand, cash, and capacity forecasts keep quietly doing their jobs.
As a result, many technology leaders face a familiar pressure: adopt the newest approach or risk looking behind. However, the better question is not which model is most advanced. Instead, it is which approach reliably improves on your current forecasting process at a cost and complexity you can sustain.
This guide answers that question in sequence. First, it frames the business decision. Next, it compares four modeling approaches, then lays out a selection matrix. Finally, it shows when an LQM pilot is genuinely justified and how to design one that can prove its value.
Before Choosing a Model, Define the Decision
A forecast only matters because someone acts on it. Therefore, model selection should start with the decision the forecast supports, not with the technology. “Improve demand planning” is a goal; “reduce safety stock across 4,000 SKUs without raising stockout rates” is a forecasting requirement.
To translate a use case into requirements, answer six questions:
- Decision and owner: What action changes based on the forecast, and who takes it?
- Horizon and granularity: Next week by store and SKU, or next quarter by region? Each implies a different model class.
- Accuracy threshold: What error level actually changes the outcome? Beyond that point, extra accuracy has no commercial value.
- Data reality: How much clean history exists, at what frequency, and which external drivers (pricing, weather, macro indicators) are reliably available?
- Explainability need: Must planners, auditors, or regulators understand why the forecast moved?
- Refresh and latency: Monthly batch runs and real-time re-forecasting carry very different infrastructure costs.
Notably, the answers often eliminate options before any model is trained. For instance, a regulated credit-loss forecast with a strict audit trail narrows the field quickly, whereas an exploratory supply-chain scenario study leaves it wide open.
Four Approaches, Four Different Strengths
Here lies a quiet trap.
Each approach solves a different kind of problem well. Consequently, treating them as rungs on a maturity ladder, where newer always means better, leads to expensive mismatches.
Statistical forecasting (ARIMA, exponential smoothing, regression) models patterns in historical time series. It is fast, cheap, transparent, and remarkably hard to beat on stable series with clear trend and seasonality.
Traditional machine learning (gradient-boosted trees, random forests, and neural networks trained on your data) learns nonlinear relationships across many drivers at once. As a result, it shines when promotions, pricing, weather, and channel mix interact in ways a statistical model cannot capture.
Large language models are trained on text, not numeric time series. In forecasting, their real value is adjacent: extracting signals from unstructured sources such as earnings calls, supplier emails, and news; explaining forecast changes in plain language; and letting planners query results conversationally. On their own, however, they are not a reliable engine for numeric prediction.
Large quantitative models are an emerging class trained on numeric, scientific, or simulated data rather than language. Some are built around physics- or equation-based simulation; others are foundation models pretrained on large volumes of time-series data. Their promise lies in modeling complex quantitative systems, generating synthetic scenarios, and transferring learning across related problems. That said, enterprise forecasting track records remain thin, so evidence must come from your own data.
The Model-Selection Matrix: Accuracy, Data, Cost, and Complexity
The matrix below compares the four approaches on the dimensions that typically decide enterprise forecasting investments. Ratings are relative, so read them as directional guidance rather than benchmarks.
| Dimension | Statistical forecasting | Traditional ML | LLMs | LQMs |
|---|---|---|---|---|
| Best fit | Stable series with clear trend and seasonality | Many interacting drivers, nonlinear effects | Unstructured signals, explanation, planner interface | Complex quantitative systems, simulation, sparse or new series |
| Data requirement | Low: a few cycles of clean history | Medium to high: rich, feature-engineered history | Text and documents; weak on raw numeric series | High, or reliant on pretrained/synthetic data |
| Compute and infrastructure | Minimal; runs on standard servers | Moderate; scales with features and SKUs | High for training; API or GPU inference costs | High; often GPU-intensive and specialized |
| Interpretability | High | Medium, with explainability tooling | Low for numbers; high for narrative | Low to medium; still maturing |
| Operating cost | Low | Moderate | Usage-based; can grow quickly | High, and less predictable |
| Skills required | Forecast analysts | Data scientists, ML engineers | Prompt and integration engineering | Specialized quantitative and ML research talent |
| Enterprise maturity | Proven | Proven | Proven for text; unproven as a numeric forecaster | Emerging |
| Default decision | Proceed as baseline | Proceed when drivers justify it | Augment, don’t replace | Pilot only when triggers are met |
The pattern is clear: complexity and cost rise from left to right, while proven track record falls. Hence, each step to the right must earn its place with a measurable gain.
When Traditional Methods Are More Than Enough
For a large share of enterprise forecasting, well-tuned statistical and ML models are not a compromise; they are the right answer. Indeed, open forecasting competitions have repeatedly shown that simple methods and their combinations stay highly competitive with far more complex ones.
Traditional methods are usually sufficient when:
- Patterns are stable. Recurring seasonality and gradual trends are exactly what statistical models capture best.
- The bottleneck is data, not algorithms. Missing promotions history, inconsistent hierarchies, or late actuals will undermine any model. In that case, fixing the pipeline delivers more accuracy than upgrading the model.
- Explainability is non-negotiable. Finance, credit risk, and regulated insurance forecasts must withstand audit, and transparent models make that far easier.
- Accuracy gains no longer move the decision. Once error falls below the threshold that changes an action, further improvement adds cost without adding value.
- The team must own it. A model your planners understand and trust will outperform a superior model they override.
In practice, the commercial case is just as strong. Lower compute, faster retraining, and existing skills mean that simpler models typically reach production sooner and cost less to run. Thus, the hard step is not choosing them; it is resisting the urge to replace them before something better is proven.
Where an LQM Pilot Could Make Sense
An LQM pilot is worth considering when the problem itself outgrows what history-based models can represent. In other words, the trigger is a structural limitation, not curiosity about new technology.
Strong candidates typically share one or more of these traits:
- Tightly coupled quantitative systems. Energy loads, commodity flows, process yields, or multi-echelon supply networks where many variables influence one another at once.
- Simulation and “what-if” requirements. Leaders need to stress-test scenarios that have never occurred, such as a new tariff regime or a plant outage, rather than extrapolate from the past.
- Sparse or new-entity history. New products, sites, or markets lack the history that statistical and ML models depend on, so pretrained or transferable models may help.
- Physics, chemistry, or engineering constraints. In sectors such as mining, materials, and energy, outcomes follow known physical relationships that pure pattern-matching ignores.
- High-value decisions. A small accuracy gain on capital allocation, inventory, or capacity commitments must be worth more than the pilot’s full cost.
Conversely, if your current models already meet the accuracy threshold, or if data quality is the binding constraint, an LQM pilot is premature.
Designing a Pilot That Can Justify Its Investment
A pilot succeeds when it produces a clear go or no-go answer, not when it produces an impressive demo. Accordingly, define the evaluation before any model is built.
Benchmarks. Compare the LQM against three baselines on identical data: a naive forecast (such as last period or seasonal naive), your best statistical model, and your best ML model. If it cannot beat the strongest of these, the pilot has answered its question.
Evaluation criteria. Agree on these upfront:
- Accuracy: error metrics suited to the decision, such as MAPE, WAPE, or MASE for point forecasts and pinball loss or interval coverage for probabilistic ones
- Robustness: performance on held-out periods that include shocks, not only calm ones
- Business impact: the forecast error translated into inventory, cost, revenue, or risk outcomes
- Explainability: whether planners and risk owners can understand and act on the output
- Total cost: compute, licensing, integration, talent, and ongoing monitoring
Infrastructure requirements. Scope GPU access, data pipelines, MLOps tooling, and security review early. Otherwise, a technically successful pilot can stall at the point of scaling.
Measurable outcomes. Set a fixed time box and a pass threshold in advance: for example, a defined error reduction against the best baseline on a defined scope, at a projected cost that the business case can absorb. Finally, commit to the outcome either way; a well-run pilot that says “no” still saves significant future spend.
The Decision Framework: Start Simple, Prove Value, Then Scale
The pathway below turns the matrix into a sequence. Each step adds complexity only after the simpler approach has been measured against the accuracy threshold and found short.
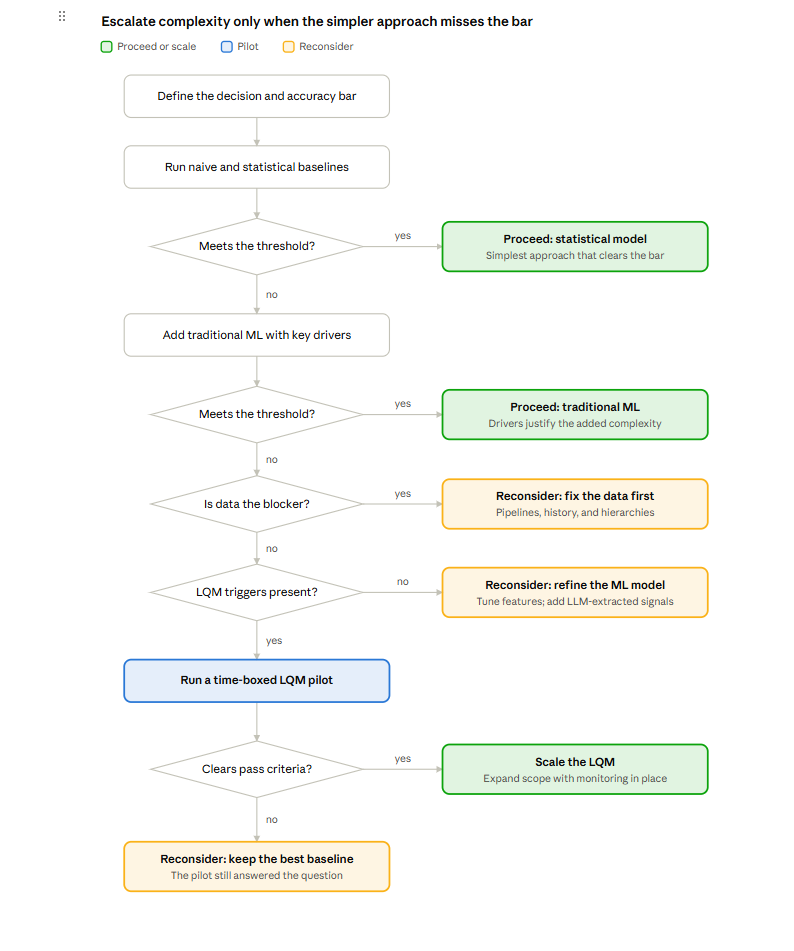
The Right Model Is the One That Proves Its Value
The strongest enterprise forecasting programs are not defined by the most advanced model in their stack. Rather, they are defined by discipline: clear decision requirements, honest baselines, and a willingness to scale only what proves its worth. LLMs can sharpen the signals and the story around a forecast, and LQMs may unlock problems history alone cannot solve. Even so, the starting point stays the same: the simplest approach that reliably beats what you do today.
